Dashboard
Overview
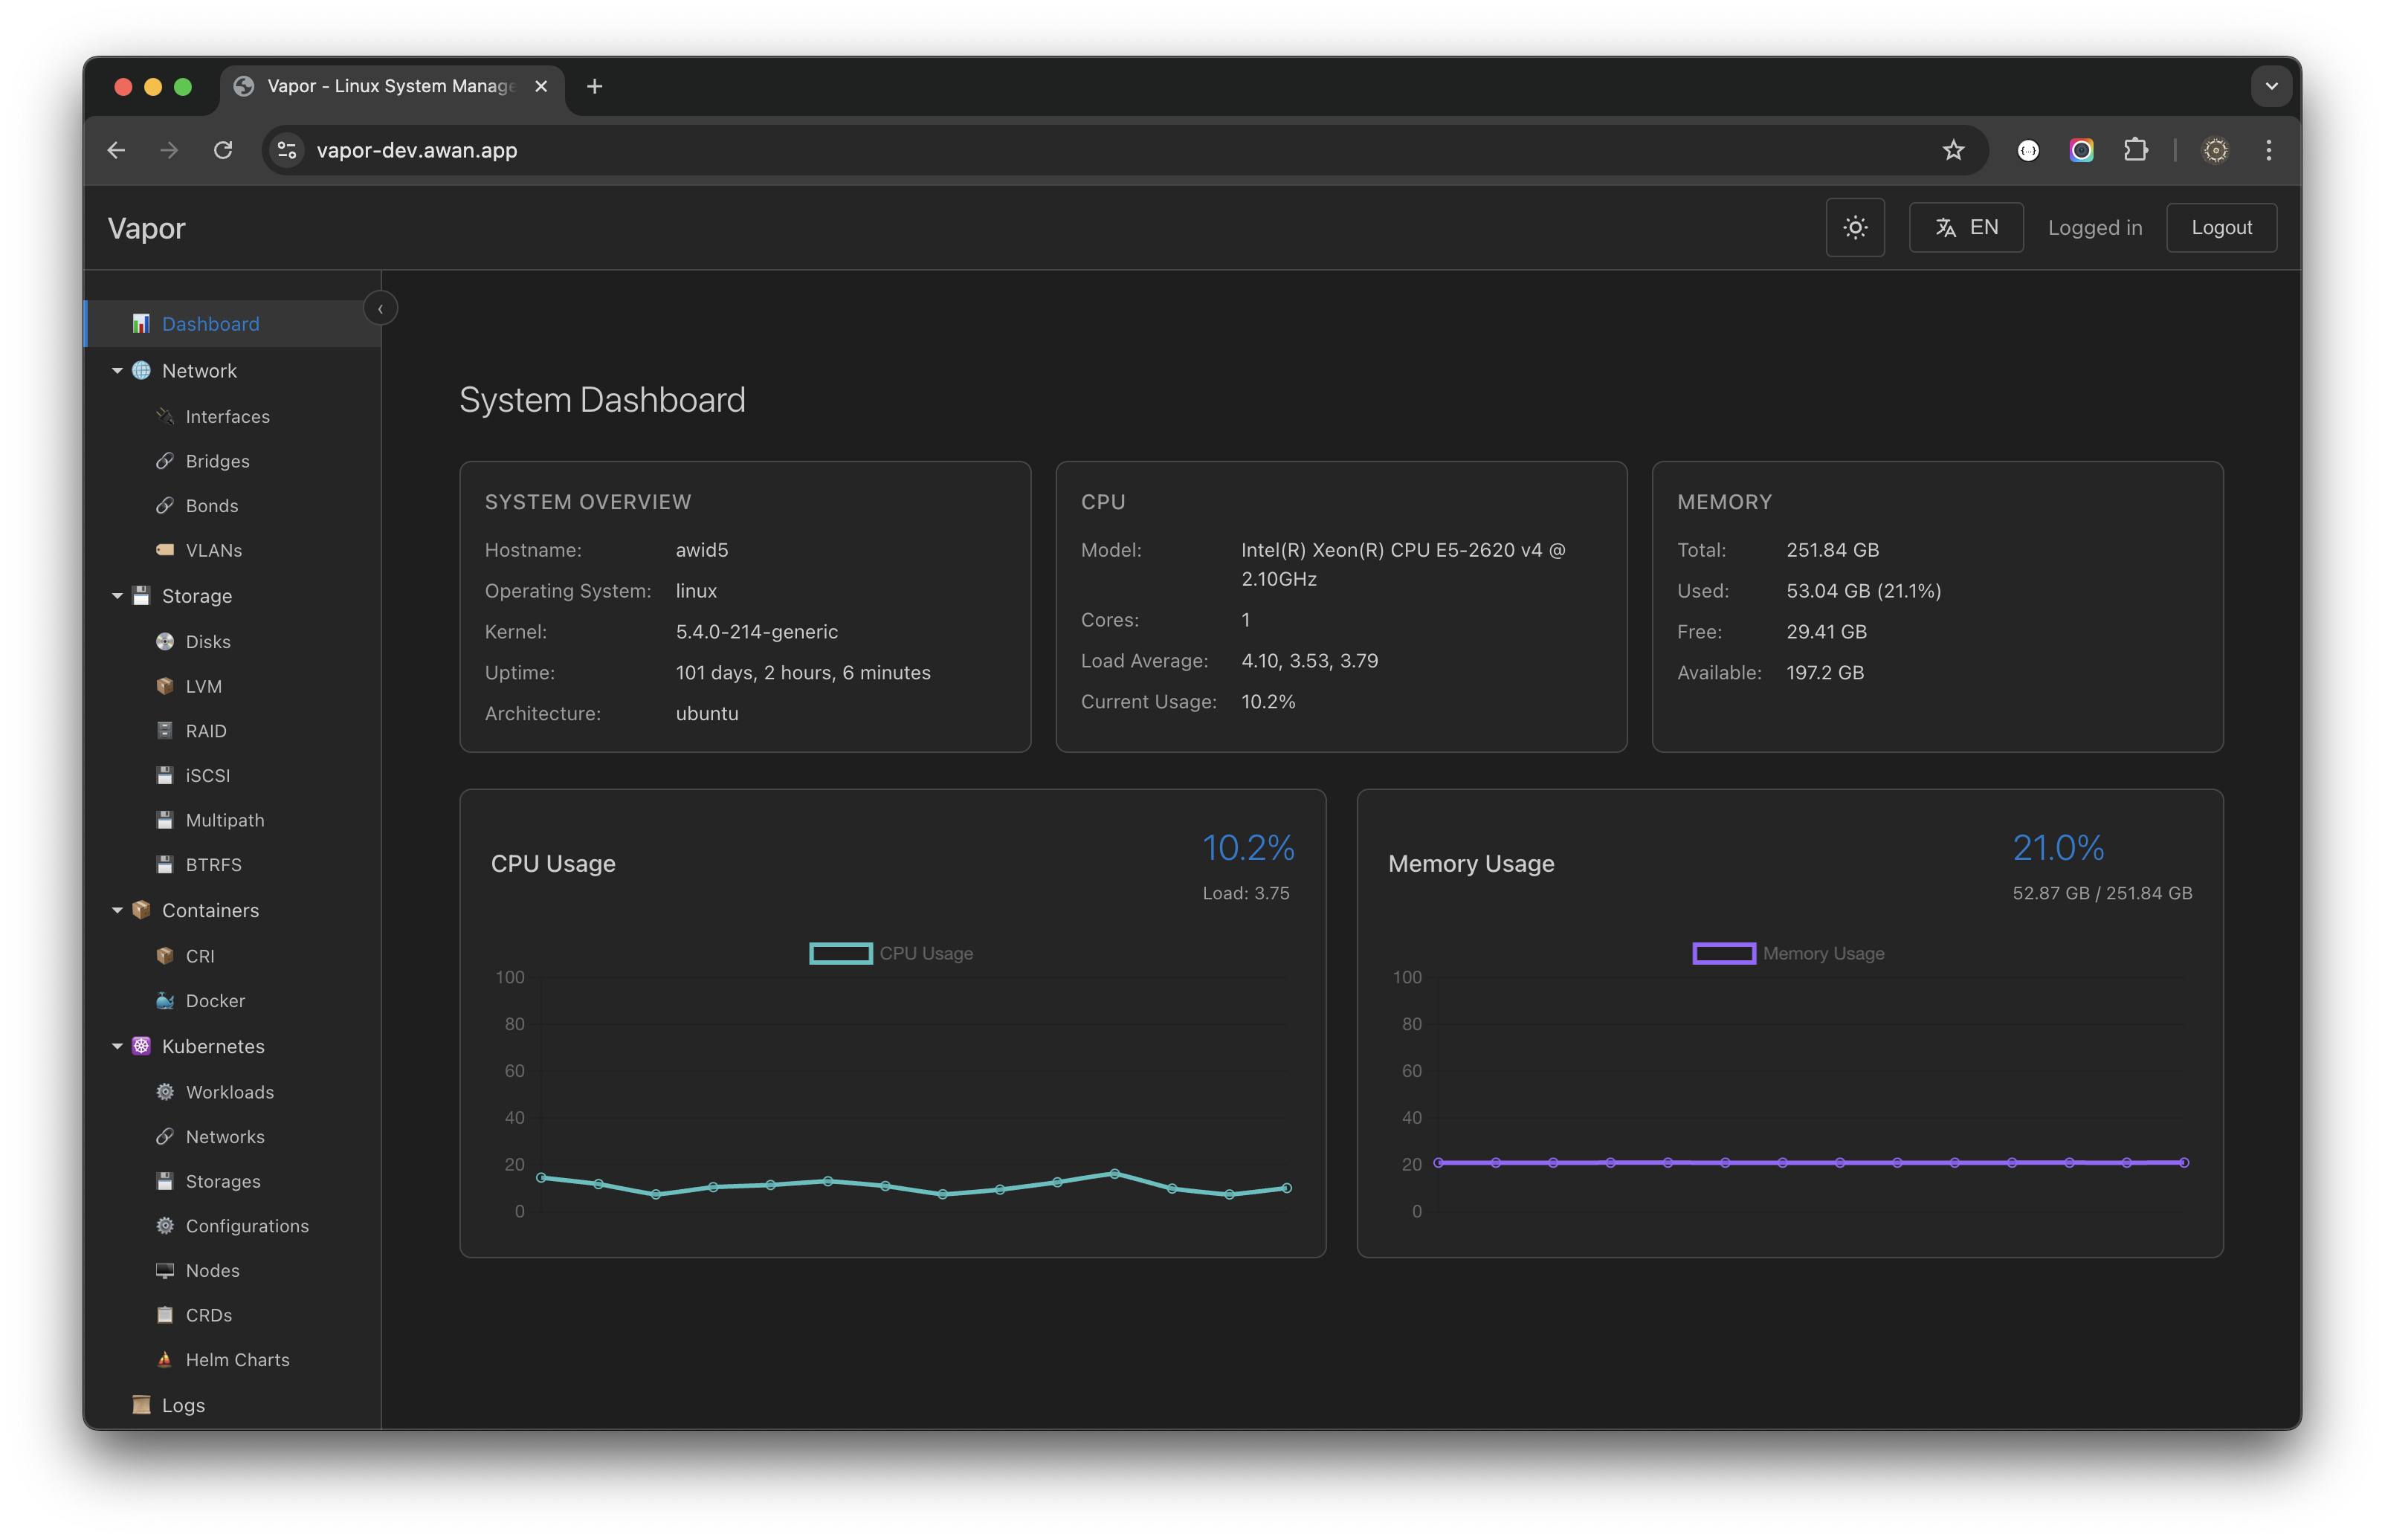
The Vapor Dashboard provides a comprehensive real-time view of your system's health and performance. It's the first screen you see after logging in and serves as your command center for system monitoring.
Dashboard Layout
The dashboard is divided into several key sections:
1. System Overview Panel
Located in the top-left corner, this panel displays essential system information:
- Hostname: The name of your server
- Operating System: Linux distribution and version
- Kernel: Kernel version information
- Uptime: How long the system has been running
- Architecture: System architecture (e.g., x86_64, ARM64)
Example:
Hostname:        avid5
Operating System: linux
Kernel:          5.4.0-214-generic
Uptime:          101 days, 2 hours, 6 minutes
Architecture:    ubuntu
2. CPU Information Panel
The CPU panel provides detailed processor information:
- Model: Full processor name and specifications
- Cores: Number of CPU cores available
- Load Average: System load over 1, 5, and 15 minutes
- Current Usage: Real-time CPU utilization percentage
Example:
Model:         Intel(R) Xeon(R) CPU E5-2620 v4 @ 2.10GHz
Cores:         1
Load Average:  4.10, 3.53, 3.79
Current Usage: 10.2%
3. Memory Information Panel
Displays comprehensive memory statistics:
- Total: Total system memory
- Used: Currently used memory with percentage
- Free: Immediately available memory
- Available: Memory available for allocation without swapping
Example:
Total:     251.84 GB
Used:      53.04 GB (21.1%)
Free:      29.41 GB
Available: 197.2 GB
Real-Time Metrics
CPU Usage Graph
The CPU usage graph shows:
- Real-time updates: Updates every second via WebSocket
- Historical data: Last 5 minutes of CPU usage
- Interactive: Hover to see exact values
- Color coding:
- Green (0-50%): Normal usage
- Yellow (50-80%): Moderate usage
- Red (80-100%): High usage
Memory Usage Graph
The memory usage graph displays:
- Memory consumption: Real-time memory usage
- Trend analysis: Visual representation of memory trends
- Buffer/Cache: Distinguishes between used and cached memory
- Swap usage: If swap is configured
Interactive Features
1. Auto-Refresh
All metrics update automatically in real-time:
- System metrics: Every 1 second
- Graphs: Continuous streaming
- No manual refresh needed
2. Detailed Views
Click on any panel to access detailed information:
- CPU Panel → Detailed CPU statistics and per-core usage
- Memory Panel → Memory breakdown by type
- System Panel → Full system information
3. Quick Actions
Available from the dashboard:
- View Processes: Quick link to process management
- System Logs: Jump to recent system logs
- Network Status: View network interfaces
- Storage Overview: Check disk usage
Understanding the Metrics
Load Average
The three load average numbers represent:
- 1-minute average: Immediate system load
- 5-minute average: Recent trend
- 15-minute average: Longer-term pattern
Rule of thumb: Load average should generally be less than the number of CPU cores.
Memory Types
- Used: Active memory by applications
- Free: Completely unused memory
- Available: Memory that can be freed if needed
- Buffers/Cache: Memory used for performance optimization
CPU States
The CPU usage includes:
- User: Time spent on user processes
- System: Time spent on kernel operations
- Idle: Time CPU is not being used
- I/O Wait: Time waiting for disk/network operations
Dashboard Customization
Theme Selection
Toggle between dark and light themes:
- Click the theme icon (🌓) in the top bar
- Dashboard adapts to your preference
- Charts and graphs adjust colors automatically
Language Support
Switch between English and Indonesian:
- Click the language icon (🌐)
- All labels and text update immediately
- Number formats adjust to locale
Performance Optimization
The dashboard is optimized for:
- Low bandwidth: Efficient WebSocket data transfer
- High frequency updates: Without overwhelming the browser
- Large displays: Scales from mobile to 4K screens
- Multiple tabs: Pauses updates when tab is not visible
Troubleshooting Dashboard Issues
Metrics Not Updating
If real-time metrics stop updating:
- Check the connection indicator in the status bar
- Verify WebSocket connection is active
- Refresh the page if needed
High Resource Usage
If the dashboard itself uses too much CPU:
- Reduce update frequency in settings
- Close unused dashboard tabs
- Use light theme for better performance
Data Accuracy
For the most accurate data:
- CPU metrics: Averaged over 1 second
- Memory metrics: Snapshot every second
- Load average: Kernel-reported values
Mobile Experience
On mobile devices:
- Panels stack vertically
- Graphs resize automatically
- Touch gestures for graph interaction
- Simplified layout for smaller screens
Keyboard Shortcuts
Speed up navigation with keyboard shortcuts:
R- Refresh all metricsD- Toggle dark/light themeF- Toggle fullscreen?- Show keyboard shortcuts
Export and Reports
From the dashboard, you can:
- Export metrics: Download current data as CSV
- Generate reports: Create PDF summaries
- Share snapshots: Share dashboard state via link
- API access: Get raw data via REST API
Integration with Other Features
The dashboard integrates with:
- Alerts: Visual indicators for system alerts
- Notifications: Real-time problem notifications
- Logs: Quick access to related log entries
- Terminal: Open terminal for immediate action
Best Practices
- Monitor regularly: Check dashboard at least daily
- Set up alerts: Configure thresholds for critical metrics
- Understand baselines: Know your system's normal behavior
- React to trends: Address issues before they become critical
Next Steps
- Learn about Network Management
- Configure System Alerts
- Explore API Integration